1. PREFACE TO LINEAR REGRESSION
Linear regression falls under a class of Machine Learning problems generally referred to as “function approximation”. Function approximation is a subset of problems that are called supervised learning problems. Linear regression also has a classifier cousin called logistic regression.2. Ordinary least squares (OLS) regression
Think of OLS as fitting a line through a group of points, as in Figure 1-1. This is a simple prediction problem: predicting y, the target value given a single attribute x. For example, the problem might be to predict men's salaries using only their heights. Height is slightly predictive of salaries for men (but not for women).
3. DEGREES OF FREEDOM
The points represent men's salaries versus their heights. The line in Figure 1-1 represents the OLS solution to this prediction problem. In some sense, the line is the best predictive model for men's salaries given their heights. The data set has six points in it. Suppose that the data set had only two points in it. Imagine that there's a population of points, like the ones in Figure 1-1, but that you do not get to see all the points. Maybe they are too expensive to generate. To simulate this in the simple example, imagine that instead of six points you're given only two of the six points. How would that change the nature of the line fit to those points? It would depend on which two points you happened to get. To see how much effect that would have, pick any two points from Figure 1-1 and imagine a line through them. Figure 1-2 shows some of the possible lines through pairs of points from Figure 1-1. Notice how much the lines vary depending on the choice of points.The problem with having only two points to fit a line is that there is not enough data for the number of degrees of freedom. A line has two degrees of freedom. Having two degrees of freedom means that there are two independent parameters that uniquely determine a line. You can imagine grabbing hold of a line in the plane and sliding it up and down in the plane or twisting it to change its slope. So, vertical position and slope are independent. They can be changed separately, and together they completely specify a line. The degrees of freedom of a line can be expressed in several equivalent ways (where it intercepts the y‐axis and its slope, two points that are on the line, and so on). All of these representations of a line require two parameters to specify. When the number of degrees of freedom is equal to the number of points, the predictions are not very good. The lines hit the points used to draw them, but there is a lot of variation among lines drawn with different pairs of points. You cannot place much faith in a prediction that has as many degrees of freedom as the number of points in your data set. The plot in Figure 1-1 had six points and fit a line (two degrees of freedom) through them. That is six points and two degrees of freedom.
4. REGRESSION:
Regression is the task of learning a target function ‘f’ that maps each attribute set x into a continuous-valued output y.5. ERROR FUNCTION:
Individual Error Term:Mapping errors on the graphThe goal of regression is to find a target function that can fit the input data with minimum error. The error function for a regression task can be expressed in terms of the sum of absolute or squared error:
 We are only showing d(E)/d(w0) here: Let “a” is equal to: yi – (w1).xi E = sum((a – w0)^2) E = sum(a^2 + (w0)^2 – 2(a)(w0)) d(E)/d(w0) = sum(0 + 2(w0) – 2a) RHS = sum(-2 . (a - w0)) Putting back the values of ‘a’: RHS = sum(-2 . (yi – (w1).xi – w0))


8. SCATTER PLOT FOR OUR DATA

9. SOLVING THE PROBLEM


10. LINER – CONDITIONS THAT SHOULD BE MET BY THE DATASET BEFORE WE USE LINEAR REGRESSION ON IT
Ref: Khan Academy11. LINER (From Transcript)
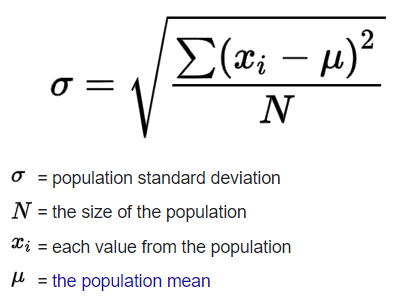
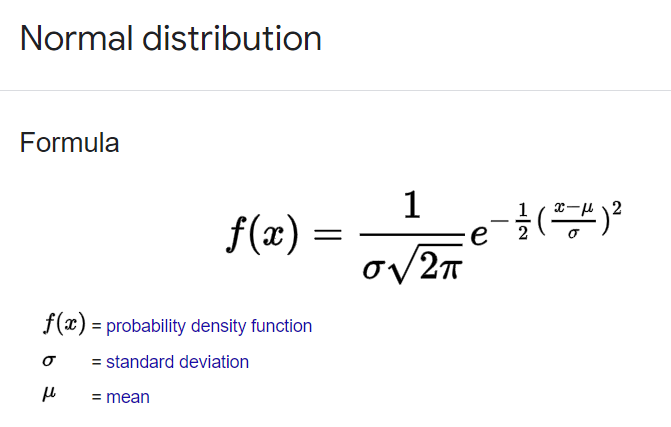
L: Linear The condition is that the actual relationship in the population between your x and y variables actually is a linear relationship. Now, in a lot of cases you might just have to assume that this is going to be the case when you see it on an exam, like an AP exam, for example. They might say, hey assume this condition is met. Oftentimes, it'll say assume of these conditions are met. They just want you to maybe know about these conditions. But this is something to think about. If the underlying relationship is nonlinear, well, then maybe some of your inferences might not be as robust. I: Independence Now, the next one is one we have seen before when we're talking about general conditions for inference, and this is the independence, independence condition And there's a couple of ways to think about it. Either individual observations are independent of each other. So you could be sampling with replacement. Or you could be thinking about your 10% rule. The size of our sample is no more than 10% of the size of the population. Similar to independence condition for proportions and for means. N: Normal Condition Arithmetic MeanStandard DeviationNormal DistributionNow, the next one is the normal condition. Although it means something a little bit more sophisticated when we're dealing with a regression. The normal condition, and, once again many times people just say assume it's been met. But let me actually draw a regression line, but do it with a little perspective, and I'm gonna add a third dimension. Let's say that's the x-axis, and let's say this is the y-axis. And the true population regression line looks like this. And so the normal condition tells us that for any given x in the true population, the distribution of y's that you would expect is normal, is normal So let me see if I can draw a normal distribution for the y's given that x. So that would be that normal distribution there. And then let's say for this x right over here, you would expect a normal distribution as well so just like, just like this. So if we're given x, the distribution of y's should be normal. Once again many times you'll just be told to assume that that has been met because it might, at least in an introductory statistics class be a little bit hard to figure this out on your own. E: Equal Variance And that's just saying that each of these normal distributions (for y) should have the same spread for a given x. And so you could say equal variance or you could even think about them having the equal standard deviation. So, for example, if, for a given x, let's say for this x, all of sudden you had a much lower variance, made it look like this, then you would no longer meet your conditions for inference. R: Random Condition This condition is that the data comes from a well-designed random sample or some type of randomized experiment And this condition we have seen in every type of condition for inference that we have looked at so far. So I'll leave you there. It's good to know It will show up on some exams. But many times, when it comes to problem solving, in an introductory statistics class, they will tell you, hey just assume the conditions for inference have been met. Or what are the conditions for inference? But they're not going to actually make you prove, for example the normal or the equal variance condition. That might be a bit much for an introductory statistics class.12. Practice Question
Ques 1: Can we solve this "y = (x^m)c" equation with linear regression? Ans 1: Equation of line: y = mx + c Log(y) = log((x^m)c) Log(y) = log(x^m) + log(c) Log(y) = m.log(x) + log(c) Y = log(y) X = log(x) C = log(c) Y = mX + C So answer is 'yes'. Ques 2: What does the term “Linear” mean in phrase “Linear Regression”? Ans 2: The model we are going to use is “Linear” in nature and we are assuming a linear relationship between dependent attributes and independent attributes. And, regression analysis is a set of statistical processes for estimating the relationships between a dependent variable and one or more real-valued independent variables. Ques 3: What is 'y-intercept'? Ans 3:
Thursday, July 15, 2021
Linear Regression (Theory)


Subscribe to:
Post Comments (Atom)
Nicely explained. Can u try to use gifs or short animations to showcase the model, it would be great value add
ReplyDelete