1) When the targets are real numbers, the problem is called a “regression problem”. 2) “Linear regression” implies using a linear method to solve a “regression problem”.1. What Are Penalized Regression Methods?
Penalized linear regression is a derivative of ordinary least squares (OLS) regression— a method developed by Gauss and Legendre roughly 200 years ago. Penalized linear regression methods were designed to overcome some basic limitations of OLS regression. The basic problem with OLS is that sometimes it overfits the problem. Think of OLS as fitting a line through a group of points. This is a simple prediction problem: predicting y, the target value given a single attribute x. For example, the problem might be to predict men's salaries using only their heights. Height is slightly predictive of salaries for men (but not for women).Suppose that the data set had only two points in it. Imagine that there's a population of points, like the ones in Figure 1-1, but that you do not get to see all the points. Maybe they are too expensive to generate, like genetic data. There are enough humans available to isolate the gene that is the culprit; the problem is that you do not have gene sequences for many of them because of cost. To simulate this in the simple example, imagine that instead of six points you're given only two of the six points. How would that change the nature of the line fit to those points? It would depend on which two points you happened to get. To see how much effect that would have, pick any two points from Figure 1-1 and imagine a line through them. Figure 1-2 shows some of the possible lines through pairs of points from Figure 1-1. Notice how much the lines vary depending on the choice of points. The problem with having only two points to fit a line is that there is not enough data for the number of degrees of freedom. A line has two degrees of freedom. Having two degrees of freedom means that there are two independent parameters that uniquely determine a line. You can imagine grabbing hold of a line in the plane and sliding it up and down in the plane or twisting it to change its slope. So, vertical position and slope are independent. They can be changed separately, and together they completely specify a line. The degrees of freedom of a line can be expressed in several equivalent ways (where it intercepts the y‐axis and its slope, two points that are on the line, and so on). All of these representations of a line require two parameters to specify. When the number of degrees of freedom is equal to the number of points, the predictions are not very good. The lines hit the points used to draw them, but there is a lot of variation among lines drawn with different pairs of points. You cannot place much faith in a prediction that has as many degrees of freedom as the number of points in your data set. Solution: Penalized linear regression provides a way to systematically reduce degrees of freedom to match the amount of data available and the complexity of the underlying phenomena. These methods have become very popular for problems with very many degrees of freedom. They are a favorite for genetic problems where the number of degrees of freedom (that is, the number of genes) can be several tens of thousands and for problems like text classification where the number of degrees of freedom can be more than a million.
2. What’s in a name?
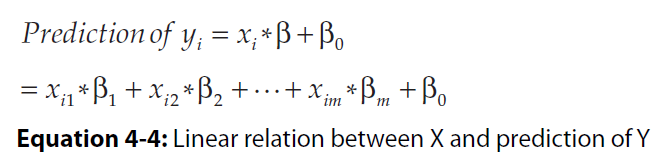
Attributes and labels go by a variety of names, and new machine learners can get tripped up by the name switching from one author to another or even one paragraph to another from a single author. Attributes (the variables being used to make predictions) are also known as the following: ■ Predictors ■ Features ■ Independent variables ■ Inputs Labels are also known as the following: ■ Outcomes ■ Targets ■ Dependent variables ■ Responses3. Linear Regression in Mathematical Equations
Following is an m-by-n matrix.


4. Forward Stepwise Regression to Control Overfitting
# ‘Forward stepwise regression’ is an improvement over “best subset selection regression”. Initialize: ColumnList = NULL Out-of-sample-error = NULL Break X and Y into test and training sets For number of column in X: For each trialColumn (column not in ColumnList): Build submatrix of X using ColumnList + trialColumn Train OLS on submatrix and store RSS Error on test data ColumnList.append(trialColumn that minimizes RSS Error) Out-of-sample-error.append(minimum RSS Error) RSS: Residual sum of squares.
5. Control Overfitting by Penalizing Regression Coefficients—Ridge Regression
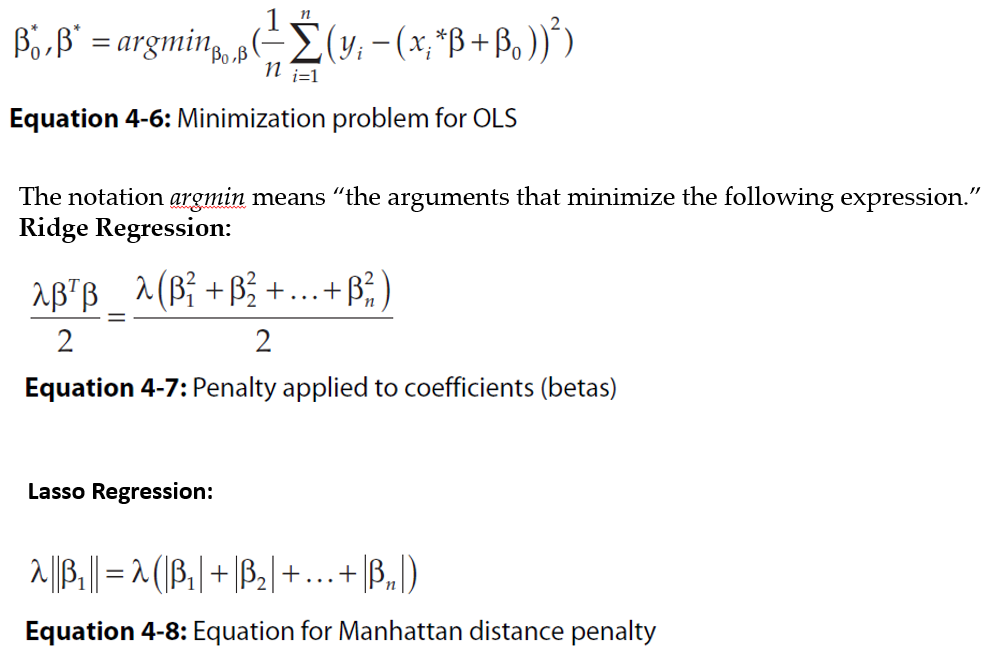
 The expression argmin means the “values of b0 and b that minimize the expression.” The resulting coefficients b0, b-star are the ordinary least squares solution. Best subset regression and forward stepwise regression throttle back ordinary regression by limiting the number of attributes used. That’s equivalent to imposing a constraint that some of the entries in the vector be equal to zero. Another approach is called coefficient penalized regression. Coefficient penalized regression accomplishes the same thing by making all the coefficients smaller instead of making some of them zero. One version of coefficient penalized linear regression is called ridge regression. Equation 3-15 shows the problem formulation for ridge regression.
 Ridge regression is available in scikit-learn.
6. Why Penalized Linear Regression Methods Are So Useful
Several properties make penalized linear regression methods outstandingly useful, including the following: ■ Extremely fast model training ■ Variable importance information ■ Extremely fast evaluation when deployed ■ Reliable performance on a wide variety of problems—particularly on attribute matrices that are not very tall compared to their width or that are sparse. Sparse solutions (that is, a more parsimonious model) ■ May require linear model7. OLS and Lasso Regression in Using Equations


8. Forward Stepwise Regression Algorithm (for computing β)
■ Initialize all the β’s equal to zero. At each step ■ Find residuals (errors) after using variables already chosen. ■ Determine which unused variable best explains residuals and add it to the mix. ~ ~ ~ The LARS algorithm is very similar. The main difference with LARS is that instead of unreservedly incorporating each new attribute, it only partially incorporates them.9. Least Angle Regression Algorithm (for computing β)
■ Initialize all β’s to zero. At Each Step ■ Determine which attribute has the largest correlation with the residuals. ■ Increment that variable’s coefficient by a small amount if the correlation is positive or decrement by a small amount if negative.

10. Practice Question
Ques: Tickets are being raised in a software such as Service Now. You have some tickets already logged and marked as 'VDI' or 'Others'. Now, for any incoming ticket, predict if it is VDI related or not using Linear Regression. Ans. We would convert our target column (VDI (Yes/No)) into two columns VDI-Y and VDI-N using One-hot encoding. Value for VDI column: yes or no VDI-yes , VDI-no Y 1 0 N 0 1 Over here we know that VDI-Y can be infered as 1 if VDI-N is 0 and vice-versa. When you would run regression for one of these two columns as target columns, we would get a value between 0 and 1. For making prediction, we set a threshold, if my vdi-yes value is greater 0.5, I would assume it is a yes and predict that the incoming ticket in ServiceNow is about VDI. DO NOT USE REGRESSION ALGORITHMS FOR CLASSIFICATION PROBLEM.
Saturday, July 17, 2021
Improvements over OLS (Forward Stepwise, Ridge, Lasso and LARS forms of Regression)


Subscribe to:
Post Comments (Atom)
No comments:
Post a Comment