We have two Excel files. x1.xlsx has sheet "EngSheet". x2.xlsx has sheet "HindiSheet". (1) Load the data. For that we use "Get Data" functionality of PowerBI. (2) We will concatenate the two sheets vertically. For that, we go to "Transform" tab of "Dashboard" (this opens "Power Query Editor") and then "Transform" tab of "Power Query Editor". (3) We select "EngSheet" from the given "Queries" column. Then, we click on "Run R Script", provided we have R installed on our system and PowerBI is configured to use it. This opens the editor, but we do not write any code in this step and "CLICK OK" to close it. (4) Ignore all "Privacy" warnings related to running scripts in the prompts that appear after step (3).(5) We go to "View" tab in "Power Query Editor" and enable "Formula Bar". The "Formula Bar" has some code like this: = R.Execute("# 'dataset' holds the input data for this script",[dataset=#"Changed Type"]) (6) We modify this line in "Formula Bar" to pass our two datasets as the input to the R script. For that the code is: = R.Execute("# 'dataset' holds the input data for this script",[dataset=EngSheet, dataset2=HindiSheet]) Note: The output of this activity will go into the "EngSheet" (denoted by "dataset" above) overwriting its contents. If you have selected "HindiSheet" from "Queries" column in step (3), and in you are passing it as one of the table in arguments as in: dataset=EngSheet, dataset2=HindiSheet You will encounter error: Expression.Error: A cyclic reference was encountered during evaluation. (7) To resolve this we create a third "XLSX" file (xl3.xlsx) with a sheet named "Sheet1" and sheet has a header with "col1" and "col2" written in the first two cells of the first row. (8) Load xl3.xlsx in PowerBI workspace. (9) We go to "Transform" tab of "Dashboard" (this opens "Power Query Editor") and then "Transform" tab of "Power Query Editor". Now, we select "Sheet1" from the given "Queries" column. "Queries" column shows all the three sheets we have loaded in the PowerBI workspace. (10) We click on "Run R Script" and "CLICK OK" to close the "Script Editor". (11) In the formula bar, enter: = R.Execute("# 'dataset' holds the input data for this script",[dataset=EngSheet, dataset2=HindiSheet]) (12) We need an R package, "sqldf" for this activity. If you don't have it, install it first from "RGui": > library(sqldf) Error in library(sqldf) : there is no package called ‘sqldf’ > install.packages('sqldf') Warning in install.packages("sqldf") : 'lib = "C:/Program Files/R/R-4.0.3/library"' is not writable Installing it in "Temp" or "Local Documents". --- Please select a CRAN mirror for use in this session --- also installing the dependencies ‘ellipsis’, ‘glue’, ‘bit’, ‘rlang’, ‘vctrs’, ‘digest’, ‘bit64’, ‘blob’, ‘memoise’, ‘pkgconfig’, ‘Rcpp’, ‘BH’, ‘plogr’, ‘gsubfn’, ‘proto’, ‘RSQLite’, ‘DBI’, ‘chron’ trying URL 'https://cloud.r-project.org/bin/windows/contrib/4.0/ellipsis_0.3.1.zip' Content type 'application/zip' length 46014 bytes (44 KB) downloaded 44 KB ... ... etc., etc. (13) In the "Power Query Editor", Click "Run R Script". (14) Enter the following R code: # 'dataset' holds the input data for this script library(sqldf) m <- sqldf("select Name as AllNames, Personal_Number as AllNums from dataset union all select Naam as AllNames, Ank as AllNums from dataset2") Click "OK". If you encounter an error such as "Error: no such table: dataset2", make sure you have a code snippet like the one below in the "Formula Bar":
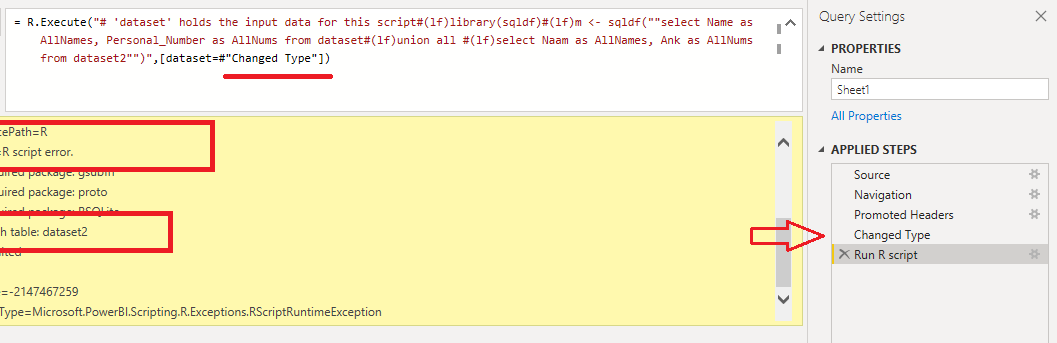
 = R.Execute("# 'dataset' holds the input data for this script#(lf)library(sqldf)#(lf)m <- sqldf(""select Name as AllNames, Personal_Number as AllNums from dataset#(lf)union all #(lf)select Naam as AllNames, Ank as AllNums from dataset2"")",[dataset=EngSheet, dataset2=HindiSheet])
 If you have a Space in a column (if "Personal_Number" is present as "Personal Number"), you get following error for code: # 'dataset' holds the input data for this script library(sqldf) m <- sqldf("select Name as AllNames, 'Personal Number' as AllNums from dataset union all select Naam as AllNames, Ank as AllNums from dataset2")
 (15) "Close And Apply" the "Power Query Editor". (16) "Table Visual" of Sheet1:
 Additional Note 1: If you want to format a 'Date' type column in R: dataset$derived_date <- format(as.Date(dataset$GIVEN_DATE), '%Y-%m-%d') 2: If you want to create a new column (of String type) by concatenating values from two other columns: select OLD_COL_1 || ', ' || OLD_COL_2 as NEW_COL from dataset GitHub Link to Excel Files and PowerBI Dashboard: GitHub References % R Packages that are not supported in PowerBI % Create an Empty DAX Table CustomTable1 = DATATABLE ( "Other Measures", INTEGER, {{0}})
Showing posts with label R Language. Show all posts
Showing posts with label R Language. Show all posts
Thursday, October 29, 2020
Concatenate Two Tables using R in PowerBI


Subscribe to:
Posts (Atom)