Past 5 Years (2021-06-21)All Time (2019-05-02) All Time (2021-06-21)
 My Time
 Monthly Saturday, May 4, 2019 In 136 months, the market had downfall, it was bearish. In 168 months, the market saw a rise, it was bullish. Bulls to bears ratio is: 1.23 and bears to bulls ratio is: 0.81 Monday, Jun 21, 2021 Negative 147 Positive 183 Bulls to bears: 1.24 Bears to bulls: 0.803 Quarterly Saturday, May 4, 2019 If we look at the quarterly data, then we have the following results: In 43 quarters, the market had downfall, it was bearish. In 59 quarters, the market saw a rise, it was bullish. Bulls to bears ratio is: 1.37 and bears to bulls ratio is: 0.76 Monday, Jun 21, 2021 Negative 46 Positive 64 Bulls to bears: 1.391304347826087 Bears to bulls: 0.71875 Half years Saturday, May 4, 2019 If we look at the half years (i.e., Jan-Jun and Jul-Dec), then we have the following results: In 20 half-years, we had a bearish market. In 31 half-years, we had a bullish market. Bulls to bears ratio is: 1.55 and bears to bulls ratio is: 0.64 Monday, Jun 21, 2021 Negative 21 Positive 34 Bulls to bears: 1.61 Bears to bulls: 0.61 Yearly Saturday, May 4, 2019 If we look at the yearly figures (i.e., 1-Jan to 31-Dec), then we have the following results: In 8 years, we had a bearish market. In 18 years, we had a bullish market. Bulls to bears ratio is: 2.25 and bears to bulls ratio is: 0.44 Monday, Jun 21, 2021 Negative 8 Positive 20 Bulls to bears: 2.5 Bears to bulls: 0.4 Bi-yearly Saturday, May 4, 2019 If we look at the bi-yearly figures, then we have the following results: In 4 bi-yearly periods, we had a bearish market. In 9 bi-yearly periods, we had a bullish market. Bulls to bears ratio is: 2.25 and bears to bulls ratio is: 0.44 Monday, Jun 21, 2021 Negative 4 Positive 10 Bulls to bears: 2.5 Bears to bulls: 0.4 Tri-yearly Saturday, May 4, 2019 If we look at the tri-yearly figures, then we have the following results: In 2 tri-yearly periods, we had a bearish market. In 7 tri-yearly periods, we had a bullish market. Bulls to bears ratio is: 3.5 and bears to bulls ratio is: 0.28 Monday, Jun 21, 2021 Negative 2 Positive 8 Bulls to bears: 4.0 Bears to bulls: 0.25 Four-yearly Saturday, May 4, 2019 If we look at the four-yearly figures, then we have the following results: In 1 four-yearly periods, we had a bearish market. In 6 four-yearly periods, we had a bullish market. Bulls to bears ratio is: 6 and bears to bulls ratio is: 0.16 Monday, Jun 21, 2021 Negative 1 Positive 6 Bulls to bears: 6.0 Bears to bulls: 0.16 Five-yearly Saturday, May 4, 2019 If we look at the five-yearly figures, then we have the following results: In 1 five-yearly periods, we had a bearish market. In 5 five-yearly periods, we had a bullish market. Bulls to bears ratio is: 5 and bears to bulls ratio is: 0.2 Monday, Jun 21, 2021 Negative 1 Positive 5 Bulls to bears: 5.0 Bears to bulls: 0.2
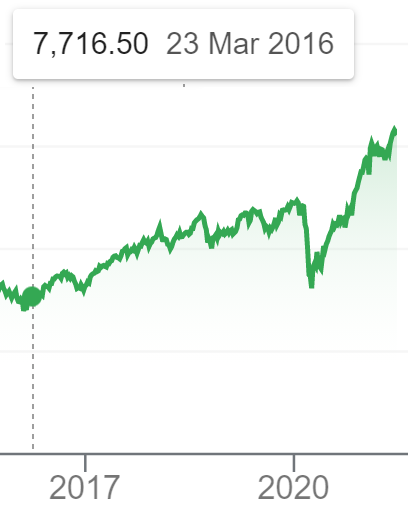
Gain Per Day For a Monthly SIP of Rs 1000 Since The Inception in 1994
Saturday, May 6, 2019: 213.426 Monday, Jun 21, 2021: 268.35
Monday, June 21, 2021
Nifty50 Statistics and Snapshots (Jun 2021)


Subscribe to:
Post Comments (Atom)
No comments:
Post a Comment