Formula For Calculating The Amount of Information in The Dataset
In plain English: Info(D) = (-1) times (summation of product of probability of class I and log of probability of class I) = Negative of summation of product of (probability of class I and log of probability of class I)Dataset
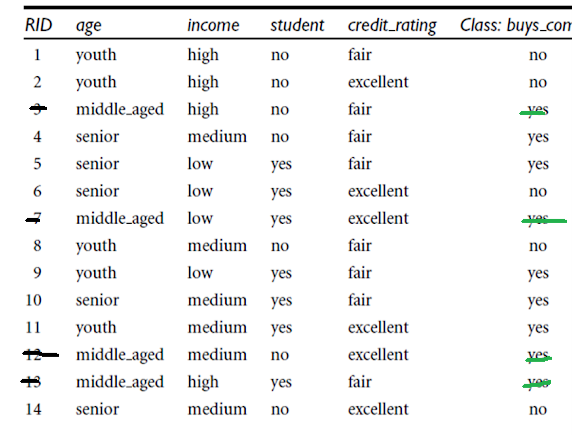
Class (buys_computer) Labels are: Yes and No How many Yes(s) are there: 9 No(s): 5 According to the formula and with log base 10: RHS = (-1) * ( ( (9/14) * log (9/14) ) + ( (5/14) * log (5/14) ) )With Log-Base-10: RHS = (-1) * ( ( (0.642) * log (0.642) ) + ( (0.357) * log (0.357) ) ) RHS = 0.283 With Log-Natural:With Log-Base-2:RHS = - ( 0.642 * ( -0.6374 ) ) - (( 0.357 ) * (-1.4854)) = 0.9394 Again, With Log-Base-10: RHS = (-1) * ( ( (0.642)* log (0.642) ) + ( (0.357) * log (0.357) ) ) = 0.283Information When We Split on Age
Age => Youth, Middle-aged, Senior Count of Youth => 5 Weight for youth => 5/14 Count of Middle-aged => 4 Weight for middle-aged => 4/14 Count of Senior => 5 Weight for Senior => 5/14 Component for YouthWith Log-Base-10: (5/14) * (-(3/5) * log (3/5) - (2/5) * log(2/5)) = 0.104 Component for middle-aged:(4/14) * ( -(4/4) * log (4/4) - 0/4 * log (0/4)) = 0 Component for senior:(5/14) * (-(3/5) * log (3/5) - (2/5) * log(2/5)) = 0.104 Information_when_we_split_on_age = 0.104 + 0 + 0.104 = 0.208 Information Gain When We Split on Age by Computation Using Log-Base-10: Info(D) - Info(on split by age) = 0.283 - 0.208 = 0.075WHAT HAPPENS WHEN WE SPLIT ON INCOME
Info(D) = 0.283 Weights for (High, Medium, and Low): High => 4/14 Medium => 6 / 14 Low => 4 / 14 Image for Income = High:Component for Income -> High = (4/14) * (-(2/4) * log (2/4) - (2/4) * log(2/4)) In Log base 10 Terms, it is: 0.086 Component for Income -> Medium =(6 /14) * (- (4/6) * log (4/6) - (2/6) * log (2/6)) = 0.118 Image for Income = Low:Component for Income -> Low = (4/14) * (-(3/4) * log(3/4) - (1/4) * log (1/4)) =0.0697 Info_when_split_on_income_for_log_base_10 = 0.086 + 0.118 + 0.0697 = 0.2737 Information Gain for Split on Age Log-Base-10 Was: Info(D) - Info(split of age) = 0.283 - 0.208 = 0.075 Information Gain for Split on Income Log-Base-10 Was: Info(D) - Info(split of Income) = 0.283 - 0.2737 = 0.0093 (Info(D) - Info(split of age)) > (Info(D) - Info(split of Income))CALCULATING INFORMATION GAIN WHEN WE SPLIT ON 'STUDENT'
'Student' Values are: Yes and No Weights for (Yes and No): Yes => 7/14 No => 7 / 14 Component for Student -> Yes =(7/14) * (-(6/7) * log(6/7) - (1/7) * log (1/7)) = 0.5 * (-0.8571 * log(0.8571) - 0.14285 * -0.8450) = 0.0890 Component for Student -> No =Component for Student -> No = (7/14) * ( -4/7 * (log 4/7) - 3/7 * log(3/7) ) = 0.054 Information (Student) = 0.0890 + 0.054 = 0.143 Information Gain = Info(D) - Info(Student) = 0.283 - 0.0890 = 0.194 Summarizing again: Information Gain for Age Log Base 10 Was: Info(D) - Info(split of age) = 0.283 - 0.208 = 0.075 Information Gain for Income Log Base 10 Was: Info(D) - Info(split of Income) = 0.283 - 0.2737 = 0.0093 Information Gain for Student with Log Base 10 was : Info(D) - Info(Student) = 0.283 - 0.194 = 0.089 We See: 0.089 > 0.075GINI INDEX COMPUTATION FOR ENTIRE DATASET
Class Label are: Yes and No How many Yes(s) are there: 9 How many No(s) are there: 5Gini(D) = 1 - (5/14)^2 - (9/14)^2 Gini(D) =0.4591 WHEN WE SPLIT ON AGE: Age => Youth, Middle-Aged, Senior Youth => 5 Weight for youth => 5/14 Middle-aged => 4 Weight for middle-aged => 4/14 Senior => 5 Weight for Senior => 5/14 For Youth:For Middle Aged:For Senior:Gini(when split on age) = (5/14) * (1 - (3/5) ^ 2 - (2/5) ^ 2 ) + (4/14) * (1 - (4/4)^2 - (0/4) ^ 2) + (5/14) * (1 - (2/5)^2 - (3/5)^2) = 0.342 Gini (when we split on income with classes {low, medium} and {high}) = = 0.714 * (1 - 0.49 - 0.09) + 0.285 * (1 - 0.0625 - 0.5625) = 0.406755 Gini(when split on 'Student' column) = 'Student' Values are: Yes and No Weights for (Yes and No): Yes => 7/14 No => 7 / 14 Component for Student -> Yes =(7/14) * (1 - (6/7)^2 - (1/7)^2) = 0.122 Component for Student -> No =(7/14) * (1 - (3/7)^2 - (4/7)^2) = 0.2448 Gini(when split on Student) = 0.122 + 0.2448 = 0.3668 Summarizing again for comparison Gini(when split on age) = 0.342 Gini (when we split on income with classes {low, medium} and {high}) = 0.406755 Gini(when split on Student) = 0.122 + 0.2448 = 0.3668 For 'Student' among (Age, Income and Student), Gini is the second lowest at 0.3668.Confusion Matrix
Decision Tree (J48) Report For 14 Txn Dataset From Weka
=== Run information === Scheme: weka.classifiers.trees.J48 -C 0.25 -M 2 Relation: 14_txn_buys_pc_numerical Instances: 14 Attributes: 5 age income student credet_rating class_buy_pc Test mode: 10-fold cross-validation === Classifier model (full training set) === J48 pruned tree ------------------ student <= 0 | age <= 0: no (3.0) | age > 0: yes (4.0/1.0) student > 0: yes (7.0/1.0) Number of Leaves : 3 Size of the tree : 5 Time taken to build model: 0.03 seconds === Stratified cross-validation === === Summary === Correctly Classified Instances 8 57.1429 % Incorrectly Classified Instances 6 42.8571 % Kappa statistic -0.0244 Mean absolute error 0.4613 Root mean squared error 0.5569 Relative absolute error 96.875 % Root relative squared error 112.8793 % Total Number of Instances 14 === Detailed Accuracy By Class === TP Rate FP Rate Precision Recall F-Measure MCC ROC Area PRC Area Class 0.200 0.222 0.333 0.200 0.250 -0.026 0.411 0.465 no 0.778 0.800 0.636 0.778 0.700 -0.026 0.411 0.662 yes Weighted Avg. 0.571 0.594 0.528 0.571 0.539 -0.026 0.411 0.592 === Confusion Matrix === a b <-- classified as 1 4 | a = no 2 7 | b = yesDecistion Tree Image For Buys a Computer or Not
Tuesday, March 15, 2022
Calculations for Info Gain and Gini Coefficient for Building Decision Tree


Subscribe to:
Post Comments (Atom)
No comments:
Post a Comment