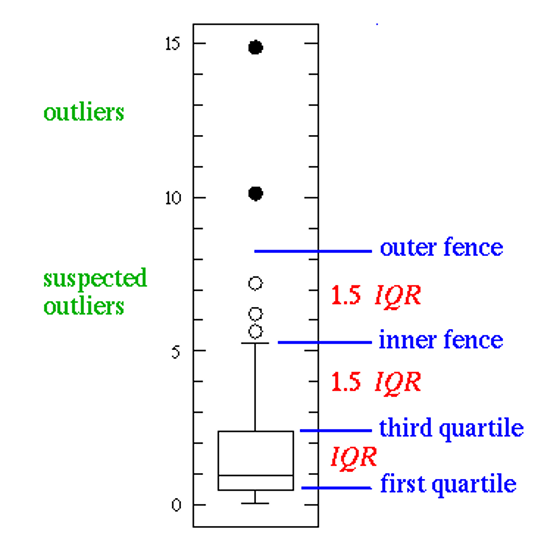
Percentile: The kth percentile of a set of data in numerical order is the value x(i) having the property that k percent of the data entries lie at or below x(i). The median is the 50th percentile. Quartile: The first quartile, denoted by Q1, is the 25th percentile the third quartile, denoted by Q3, is the 75th percentile The distance between the first and third quartiles is a measure of spread that gives the range covered by the middle half of the data. This distance is called the interquartile range (IQR): IQR = Q3 - Q1 Five-number summary of distribution consists of: Minimum, Q1, median, Q3, Maximum Box Plot:Outliers in a boxplot:
Sunday, April 24, 2022
Box Plot and Anomaly Detection in 1D


Subscribe to:
Post Comments (Atom)
No comments:
Post a Comment